Using uncompressed video in the cloud
We recently presented a paper at the SMPTE Media Technology Summit that discusses transmission of uncompressed video in the public clouds. We didn't include any per-cloud data in the paper -- instead we released some open source testing tools so the readers could perform their own tests. We were concerned that the data would be quickly out of date. But on the web we can keep it updated. This post contains our current findings, and we will try to occasionally freshen it up with new data.
If you are in a hurry you can jump to the current results, or you can read on to learn about how we transport and test the media.
How we transport uncompressed video
Uncompressed video has a fairly high bit rate. For 1080p60 video the bit rate is ~ 2.5 Gbits/s for 10 bit 4:2:2 video and ~ 8 Gbits/s for our internal compositor format (16 bits / component RGBA). Currently most clouds limit the bitrate per flow to something much lower than that. So for that and several other reasons we split each video stream into several lower bitrate UDP flowlets for transmission over the cloud network. We then reassemble the stream in a reordering buffer and recover lost packets using a convolutional code and/or ARQ.
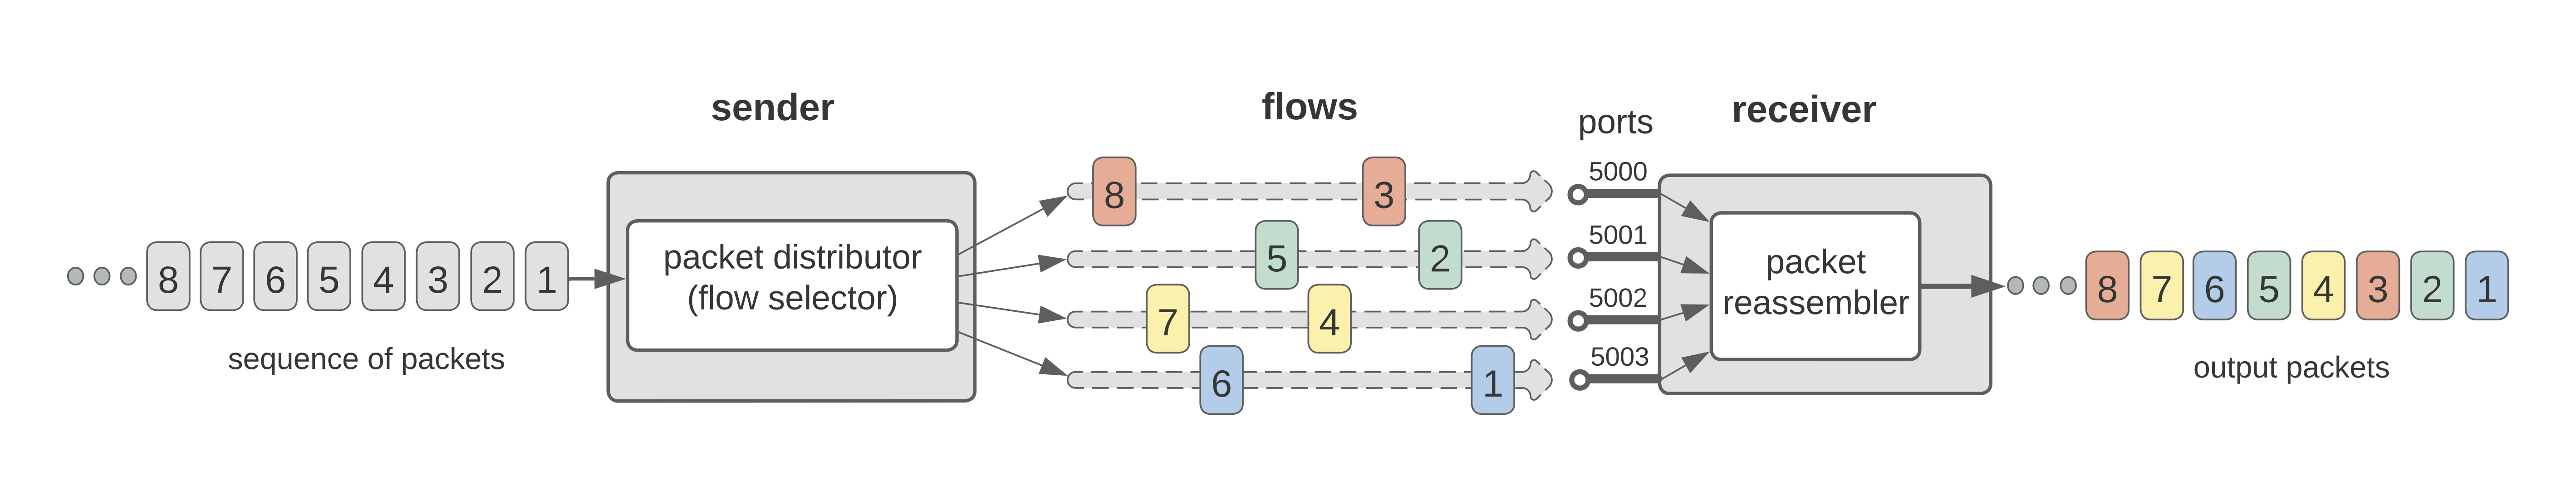
We choose to vary the destination port to define each flow. We try to set a large path MTU so we can send large packets without fragmentation. This means fewer packets per second. Some clouds will throttle you based on packets per second, and keeping it low also can reduce the number of system calls in the receiving application.
In each cell we try to place instances topologically 'close' to each other using the appropriate means, such as placement groups on AWS.
Vital stats
| AWS | Azure | Oracle | ||
|---|---|---|---|---|
| Data transfer pricing link | ||||
| Largest MTU | 9001 | 40364 but we tested using 1480 | 889610 | 9000 |
| "Close" instance placement | Cluster placement groups6 | Proximity placement groups5 | Compact placement policy7 | Common fault domain9, or cluster networking8 if you can afford it |
| "Native" uncompressed API | CDI |
The tests
We generally start with the usual network tests such as iperf3, and tracepath to make sure we have basic connectivity. Then we tend to use two other tests: windowed RTT and multiflow tests. To help you with this testing we released open source tools written especially for the SMPTE paper.
Let's describe those tests:
Windowed RTT
Measuring round trip time (RTT) can reveal a lot of things such as how electrically 'close' your instances are, which is useful by itself. If you find your normal P90 RTT has changed it could indicate a change in placement algorithm from the cloud vendor.
But we read a paper about windowed RTT testing1 and saw how measuring RTT on packets of varying sizes, and bursts of several packets can reveal even more about buffering and performance of the networking stacks. Our windowed RTT tester sample code is roughly based on that paper, and allows you to specify starting and ending packet sizes and counts (window size) that can be time varying. The data is recorded in a sqlite file for analyzing and plotting.
This test requires a sender application that sends bursts of packets to a reflector application on the other instance. Each packet contains a timestamp which is read from the received reflected packets to allow for calculation of round trip time. Note that this measured time includes the application processing time on both ends -- it is not strictly a network RTT test. This is actually a good thing for us because it measures real performance. The sender writes the results file.
Measurements like RTT make the most sense when you sample into quantiles such as P90 or P99. See the reference code for a R language script that calculates P90 of the RTT values read from the tester's sqlite file.
Multiflow error stats
Our flow test application simulates a multiple flowlet transmission, and the receiver keeps track of total and per-flow error stats, writing the measurements into another sqlite file. We typically run this application for several hours to catch problems that don't occur very often.
Warning
This test can create very high bitrate streams, which can quickly become expensive for cases where you must pay for network data transfer. Despite years of experience, we still get surprised by data transfer bills for situations we did not think of. Be careful!
Make sure your instances are where you think they should be before running this test.
The test uses sender and receiver applications. The receiver writes the results file. You typically tell them how many flowlets to use, and the bitrate of the video stream. The application will use a round-robin approach to decide which flow to use for each packet. The packets contain an overall sequence number and a separate per-flow sequence number.
Here are some things to watch for in the data:
- Flow based burst loss
-
This is a typical situation for data centers like AWS. At some point a single flow will see a burst of lost packets, and that burst may last for a second or more2. This probably means that something on that flow's route has broken or gotten extremely congested. At some point this will be corrected by the network's routing control plane, but until then it is our problem.
This error is one of the reasons we use multiple flows. If we are sending on sixteen flows and one has a temporary burst loss, this is simple to work around by either adding some forward error correction to the stream or using ARQ to get the missing packets from the flows that are not experiencing loss. In product we actually randomize the flow assignment per packet, which turns a burst error into a series of fairly easy to correct random errors in the packet reassembly buffer.
If you see burst loss on more than one flow simultaneously it could mean that the network isn't using pure ECMP routing, or there is a resource issue at points where multiple flows are present, such as on the sending or receiving instance.
- Per-flow sequence discontinuity
-
In a data center using ECMP routing we expect each packet on a flow to be routed on the same path, which means we should never see a per-flow sequence number decrease. Out of order packets imply several routes have been taken for that flow.
So far when we see this it is only true for a small number of packets. Our untested theory about this is that is could be due to the data path on the receiving instance -- the way the NIC creates queues and the way the operating system uses them.
On interpreting results
Remember that the results we measure include network errors and processing on the sending and receiving hosts. If things seem like they don't quite add up
it is probably because it happened on a host and you are trying to blame the network 
- Time correlated flow sequence discontinuity
-
If more than one flow shows errors in the same time window this usually means that the underlying network could not hash our flow's 5-tuple into a unique flow at some point. This can indicate that the network path may have been restricted, such as being routed over an inter-building link.
- Overall error rate and burst loss
-
The overall error rate is calculated using the global sequence number from each packet after the received flows have been combined into the reordering buffer. This is a good overall measure of the network health. It should be low enough to make a practical error recovery strategy useful. In our case we find we can use a simple forward error correction technique on AWS and Google, where the characteristics are optimal for this, and an ARQ based strategy on the other clouds.
Getting any large burst loss after the reordering buffer is generally bad news. If you see this regularly on a particular cloud, you may need to add enough latency to your recovery buffer to allow for retransmission of the missing packets3. In practice we find that if we see this, it usually indicates some grey failure is present, so we inform the control plane to select an alternate redundant instance until the problem ends.
See the sample code repository for some R scripts that plot the data.
Running the tests
We performed these tests on several public clouds, choosing instances the way we prefer to for a managed service: We choose the smallest and least expensive instances that can handle the network bandwidth in a steady-state manner without relying on any kind of credit based bandwidth allocation. In general we prefer ARM architecture for price vs performance reasons, but will use Intel or AMD instances on clouds where ARM is not available or appropriate. In all cases we run linux, and we choose each cloud vendor's preferred linux distribution if they have indicated a preference.
We set kernel parameters to optimize for UDP throughput and set the largest practical MTU. We try to use each cloud's closest placement configuration to minimize latency and get several ECMP routes.
The sample applications are not heavily multithreaded, so we don't choose instances with lots of VCPUs. But in almost all cases there is a link between VCPU count and network bandwidth on cloud instances, which means we are usually using instances with more VCPU than needed in order to get the high bandwidth networking. We run the applications in Docker containers using host-based networking. We do not set any affinity flags, allowing the operating system to schedule our threads on cores it chooses.
Note that the simple test code doesn't use a lot of CPU, so it works without some of the extra work, such as bypassing the linux UDP stack, you possibly would need for a serious processing application. Leaving that out makes it easier to understand what is happening (and for you to debug).
We performed the tests using the bitrate equivalent (~ 2.5 Gbits/s) of 10 bit 4:2:2 1080p59.94 video to more closely resemble the types of media streams broadcasters send between applications. You can also set the applications for other configurations including the much higher bitrate 16 bits / component RGBA (~ 8 Gbits/s) format we use internally. The clouds actually handle the 2.5 Gbit streams really well compared to our normal streams.
We used the sample code and set it for 8 flowlets.
The results
Did we miss something?
If you think we made a mistake or are not considering some important factor please contact us or leave a comment below. We want to make sure the tests are fair and correct.
The following results are for tests performed on October 21-22 2022.
Please note
The graphs printed below do not have the same scales.
AWS
We used c6gn.4xlarge instances in a cluster placement group in us-west-2. Path MTU was 9001. Our media
payload was 8100 bytes per packet.
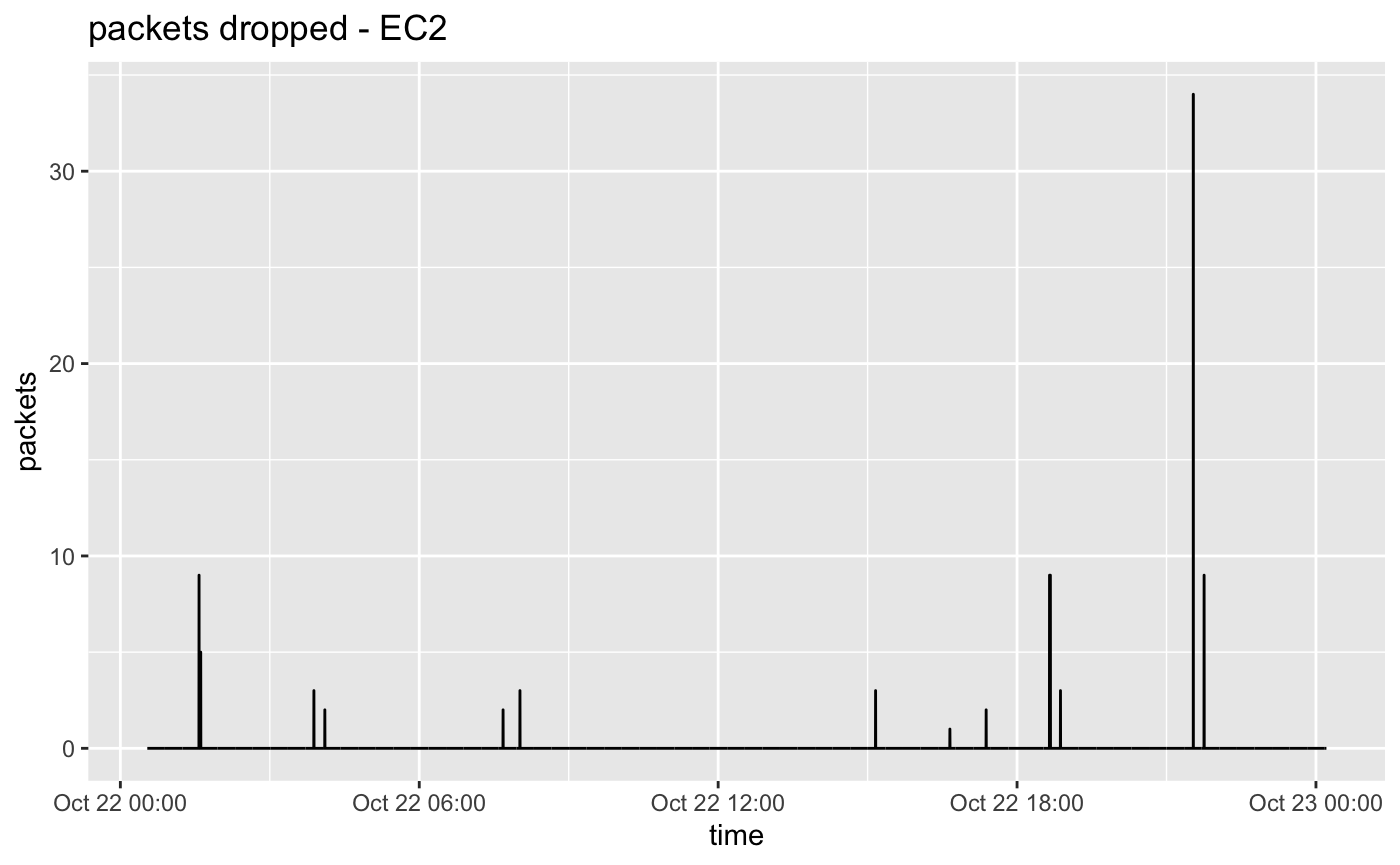
P90 RTT between instances is 0.133 milliseconds.
Overall packet loss: 0.000002%
We have seen a lot of improvement on AWS during the last two years, and it is currently really good for video at 2.5 Gbits. In our last test batch there was a small amount of packet loss -- around two packets are lost per hour. The loss is evenly distributed among all flowlets.
We normally see the lowest RTT on AWS. It was true for this round of tests and was about half of Google's RTT and 1/3 of Oracle's RTT.
Typically on AWS we'll lose one flowlet for up to a second around once per day, but this did not happen during our recent test.
Also please remember that you don't necessarily need to use flowlet code on AWS because they have CDI which may be easier to integrate into your applications.
We used c2-standard-8 instances with compact placement policy in us-west1. Path MTU was 8896. Our media
payload was 8100 bytes per packet.
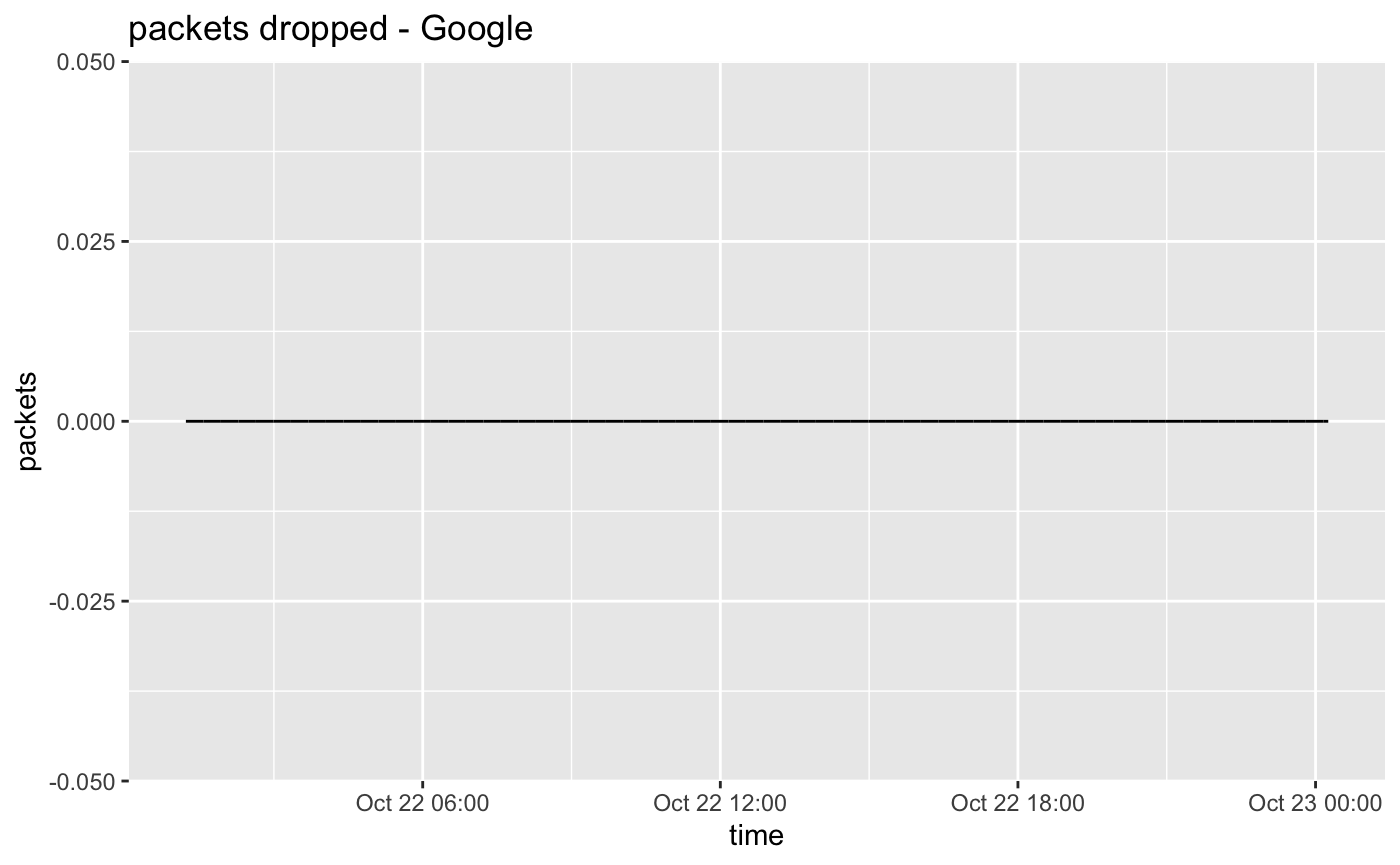
P90 RTT between instances is 0.280 milliseconds.
Overall packet loss: 0%
Our typical experience on Google is once the instances are started the quality will not change much. And lately we've had really good luck. In our last batch of testing we're getting results like no packet loss during a 24 hour test run. Maybe they know we're watching
In the past we've seen results closer to the Oracle results shown below. Some drops but still quite usable. This was the first time we've ever seen a 24 hour period with no packet loss.
Azure
We used Standard F8s v2 instances in a proximity placement group in West US 2. Path MTU was 4036. Our media
payload was 1400 bytes per packet.
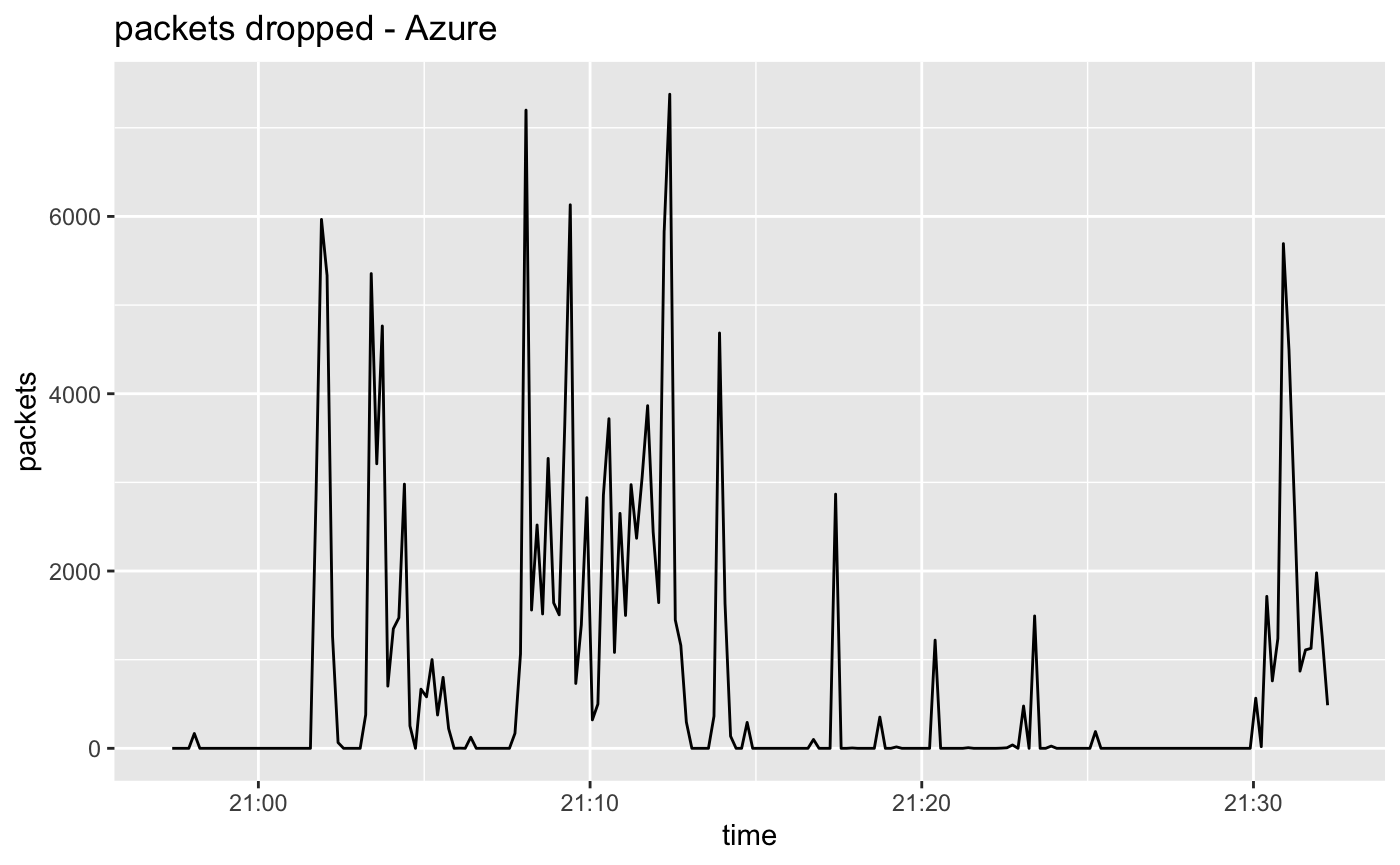
P90 RTT between instances is 0.520 milliseconds.
Overall packet loss: 0.036601%
Of all the clouds have the least understanding of Azure networking, and our requests for more information have thus far gone unanswered. Our experience on Azure is completely different from the other clouds:
- Despite being able to set a path MTU of 4036 we will have a lot of packet loss if we send more than around 1400 bytes of media in each packet.
- We can get reasonably good measurements only if we use a single flow.
On azure with the current settings we get packet loss which is the highest of the clouds we have measured, requiring us to use ARQ for recovery. The fact that performance degrades with more than one flowlet is a concern.
Here's some guessing about what may be happening here.
- We normally get really good TCP performance on Azure, so this UDP issue is probably not due to their substrate network or placement.
- Perhaps the problem is related to packet processing on their custom NIC or hypervisor.
- Note that the way we get flowlets is to change one factor: UDP dst port, on the 5-tuple we ask the NIC to deliver, but every cloud we know of will encapsulate our packets -- adding their own headers and making our packets their payload. So it is possible that our 5-tuple changes are not honored by the network card, and all packets destined for the same host get the same 5-tuple when sent to the substrate network so they follow the same route13.
We look forward to having a technical conversation with some Azure engineers some day.
Oracle
We used Standard.A1.Flex ARM based instances12 with 32 CPUs in us-sanjose-1. Path MTU was 9000. Our media
payload was 8100 bytes per packet.
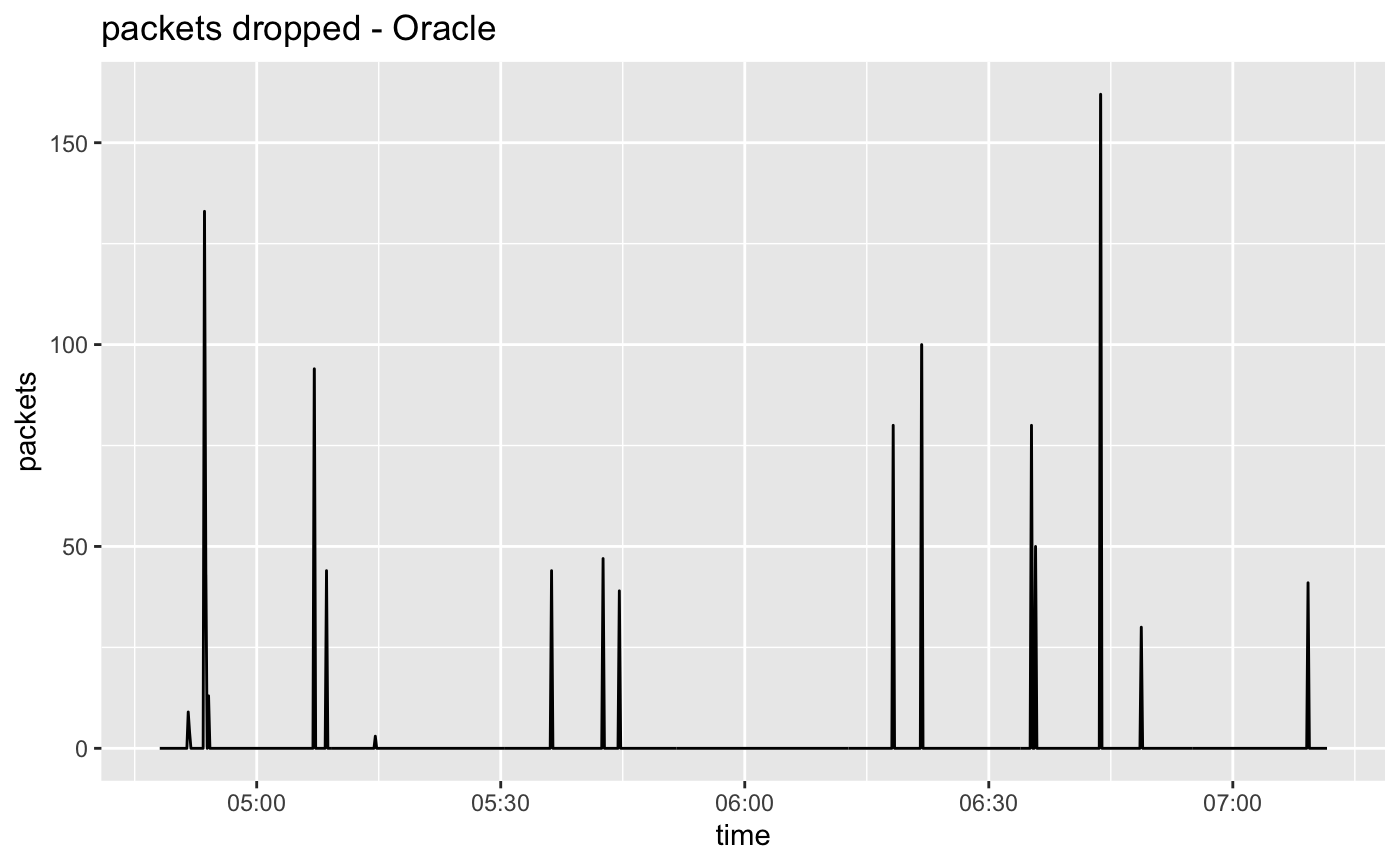
P90 RTT between instances is 0.397 milliseconds.
Overall packet loss: 0.000308%
We placed instances in a shared fault domain9 to attempt to get close placement. (Oracle offers really low latency networking for HPC-type instances but they are not within our budget.) We got a respectably low RTT, but it is 3x that of AWS. Probably the best we can do here without paying a lot more.
Oracle also had a larger packet loss rate than AWS or Google, but it is still quite low and easy to recover11.
The per-flow packet drop results from Oracle often have a very unique look: Half of the flows are drop free, while the other half contain equal amounts of loss. This seems to happen independently of the number of flows used. It sort-of looks like Oracle is really only using two routes between instances. This could be related to the higher RTT and the fact that they have a lower latency placement option we didn't take advantage of. So our topologically "close" instances appear to be not in the same ECMP routing domain. But the loss is still acceptable and the cost is low.
Summary of results
| AWS | Oracle | Azure | ||
|---|---|---|---|---|
| RTT (ms) | 0.280 | 0.133 | 0.397 | 0.520 |
| Loss (%) | 0 | 0.000002 | 0.000308 | 0.036601 |
Conclusions
It is possible today to transport uncompressed video at ~ 2.5 Gbits/s on all clouds we tested on. In the last test cycle Google was best for loss, with no packets dropped in a 24 hour test run. AWS was basically as good, dropping 51 packets in 24 hours, and had the shortest round-trip-time.
Both AWS and Google's flowlet performance is what we would expect from the type of network routing they have disclosed to the public. We get pretty good performance on Oracle but looking at flow-specific drop statistics we believe we may be only getting two routes between our machines. On Azure we can only use one flowlet and we have to send very small packets.
If we were releasing a service today at the bitrates we tested we would support AWS and Google clouds while discussing the issues mentioned above with Oracle and Azure before clearing them for our service.
Stay tuned for a future revision of this post where we test using our native 8 Gbit/s video streams.
-
Mathis, M. 1994. Windowed ping: an IP layer performance diagnostic. Computer Networks and ISDN Systems 27, 3, 449–459. ↩
-
This is why you need such a high latency (lots of buffering) for single-flow protocols like TCP. ↩
-
Some call this 'reinventing TCP with UDP'. ↩
-
Experimentally determined and not documented as far as we know. ↩
-
See Using Proximity Placement Groups in Azure documentation. ↩
-
See Cluster Placement Groups in AWS documentation. ↩
-
See Defining instance placement policies in GCP documentation. ↩
-
See Large Clusters, Lowest Latency: Cluster Networking on Oracle Cloud Infrastructure in Oracle's blog. ↩
-
See Fault Domains in Oracle's documentation. ↩↩
-
Set this when you create the VPC. Limited to a common IP4 subnet. ↩
-
We did a lot of the initial flowlet development on Oracle's cloud because it was the least expensive option available at the time. We initially used a convolutional code / low latency forward error recovery technique on flowlets because it worked fine on Oracle, Google, and AWS but have since added ARQ to handle Azure. ↩
-
These are Ampere Altra processors and instead of having some set of instance sizes Oracle allows the customer to choose the number of CPUs (currently $0.01 per cpu / hr) and the amount of memory per CPU (currently $0.0015 per Gigabyte / hour). This is cool. ↩
-
This may seem like a subtle point but it is really important for flowlets. Nobody seems to publicly document their encapsulation. So we're just hoping the cloud provider creates the 5-tuple of the encapsulation in a manner that preserves the flow intentions of the wrapped packet. We look forward to the day when we can forget about this and just use the cloud provider's transport API such as CDI. ↩